Flamegraphs and benchmarks
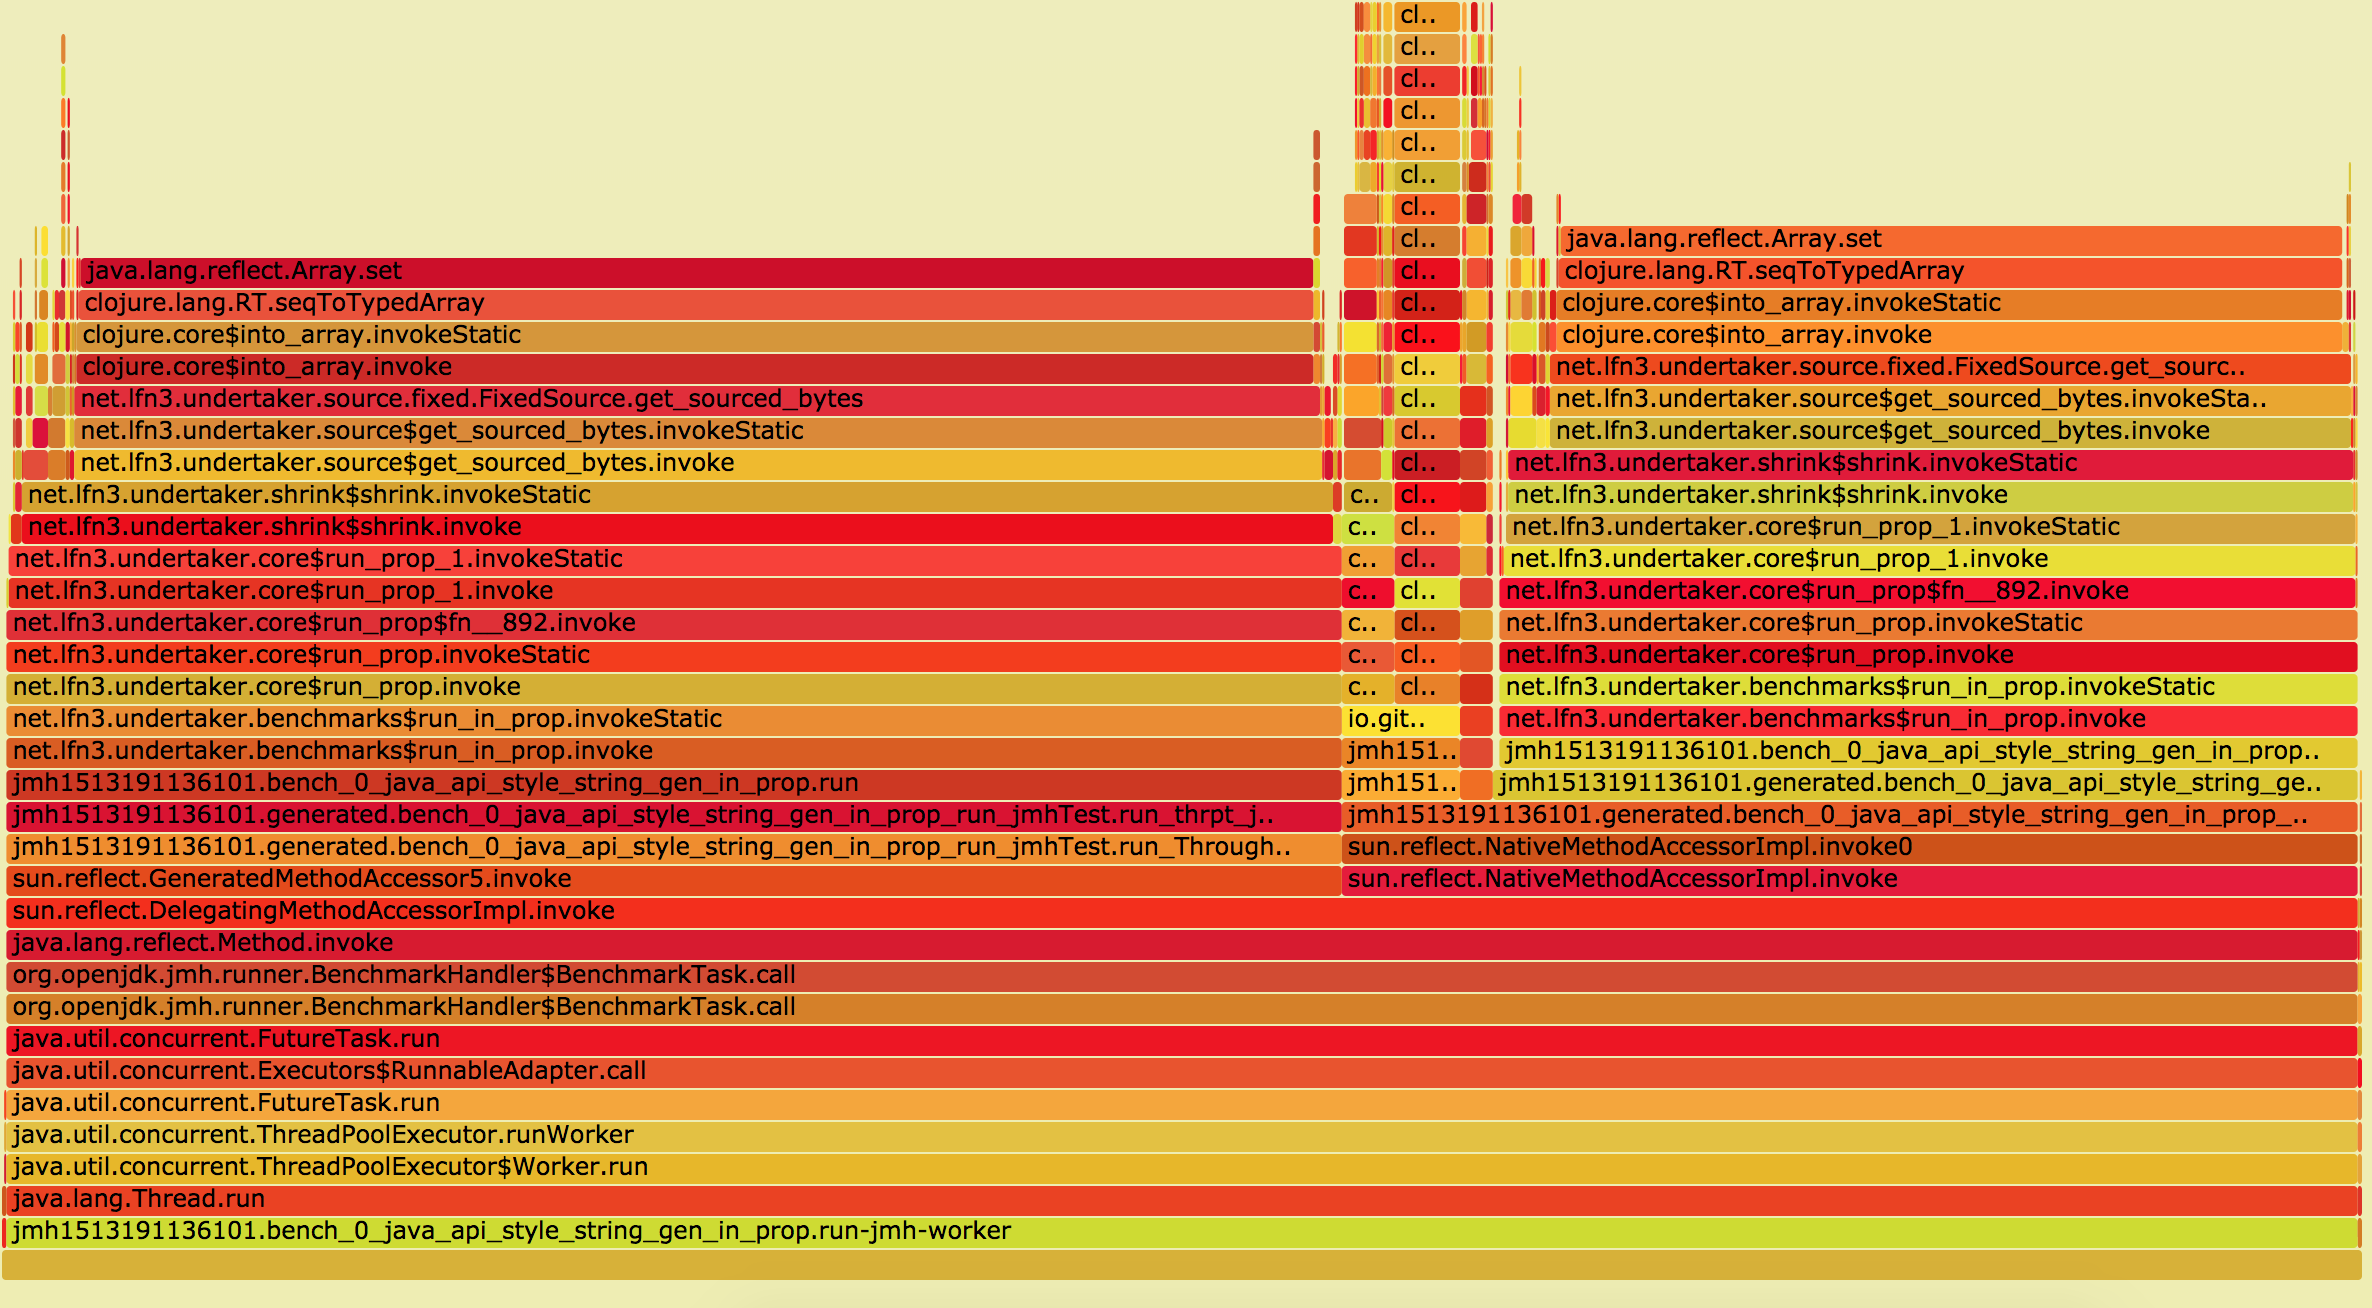
Dec 14 2017lein jmh recently turned up on the Clojure scene. I’ve been using it to debug some performance issues with a library I’m about to open source called undertaker. I’m gonna tell you a little bit about the why and the how of getting benchmarks to produce Flamegraphs like this:
Why use flamegraphs?
Why did I go to the effort of generating these things if I could just use Java Microbenchmark Harness (JMH) to figure out where it’s slow? In order to do that I’d have to write quite a lot of benchmarks to drill down into where exactly the problem is. That’s tricky and arduous, since you’ve got to make sure that each benchmark is realistic. In my case there’s quite a bit of complexity buried inside the library as well - there’s a reasonably compact public api with quite a bit of code underneath.
The other thing is anyone using the library doesn’t really care about the performance of the internals of the library. Measuring the performance of the internals doesn’t really tell me much about the user experience. Ideally what I want is comprehensive benchmarks of the public APIs, and some sort of profiling to help me figure out what code internally is slowing them down.
So what profiling options do we have? There’s stuff like Java Mission Control (JMC) that comes bundled with the Java Development Kit (JDK), but I didn’t really know how to start with scripting that. The way JMH works, (with multiple forked processes) also makes it pretty challenging to use the JMC UI to profile.
Mostly though, I’d wanted to use flamegraphs for a while, and this project was a simple one to get started on.
How do I flamegraph?
Most talks or blog posts about flamegraphs focus on using them to diagnose production issues by producing them from live workloads. What we want to do is a little different, and somewhat complicated by JMH’s way of running benchmarks. JMH runs a single benchmark repeatedly by forking a process. This makes sure that the benchmark is running in a clean, isolated environment, i.e. not impacted by other optimizations that the Java compiler has already performed.
So I started out with the crudest possible method, just using jstack, which is
again part of JDK. It’s definitely not the greatest way of doing this, but
I wanted to get it working without having to get in between the JMH runner
process and the forked process. jstack takes a pid and returns a snapshot of
the current stack. So by using jps (also included in the JDK.) to find the
forked JMH process, and running jstack against the pid:
jstack $(jps | grep ForkedMain | awk '{ print $1 }') >> /tmp/jstack
This assumes that jstack is on your path, otherwise you can find it next to
your java executable (try which java, or echo $JAVA_HOME)
Anyway, running that we get a single stack trace. We can run this in a loop to capture the output of an entire jmh run:
while true;
do
  jstack $(jps | grep ForkedMain | awk '{ print $1 }') >> /tmp/jstack
done
There’s not much smarts to that, you’ll have to manually kill it once JMH is done running. It’ll also print a bunch of stuff to stderr if a JMH forked process isn’t currently running. That aside, it’ll give you a file to feed Brendan Gregg’s flamegraph tools:
stackcollapse-jstack.pl < /tmp/jstack | flamegraph.pl > /tmp/flame.svg
And that’ll give you the beautiful picture you saw above. Or something like it. I could probably write another entire blog post about interpreting these in the context of Clojure, but the essence of it is finding your code in the graph, and then looking up the ‘flame’ to find what it’s spending it’s time doing.
Problems
So there’s some issues with this. The most obvious is the collection part. Ideally I’d use a java agent of some description to handle this, but the solutions that exist and are described mostly target linux. You’ll probably have a much better time if you’re running on linux using perf as described by Brendan. Probably the best answer on OS X would be honest profiler. I’m not sure if the output format for that is parseable by the existing flamegraph tools, or if I can get it to start outputting on program startup.
There’s obviously some overhead to whatever technique you use to capture the stack. This means the benchmark results you get are almost certainly suspect while you’re profiling. When I’m using this technique I’m usually looking at a specific benchmark so I don’t record the results anyway.
I’d recommend only using this against a single benchmark, otherwise you’ll mix the profiles of several benchmarks together. In terms of feedback it’s a lot faster when you do it that was as well.
In terms of ease, however, this is second to none. If you’re writing java, you’ve already got jstack, and jmh and the FlameGraph scripts are both easy to use and cross platform.
These issues aside, the insight I’ve gotten from this profiling and visualization has been invaluable. I’ve gotten a 4x speedup (enough for my case, for now) and it’s given me a good idea of what to go after next.
So if you’re having perf issues, and you’re a bit too lazy to write benchmarks for all the things, I’d highly recommend it.