Performance checks on metrics
Apr 24 2017At LMAX we do [a lot of automated testing] (https://www.symphonious.net/testing-at-lmax/), including running several dedicated environments for performance testing. We’ve got a lot of specific numbers that come out of these environments that we surface on dashboards like this:
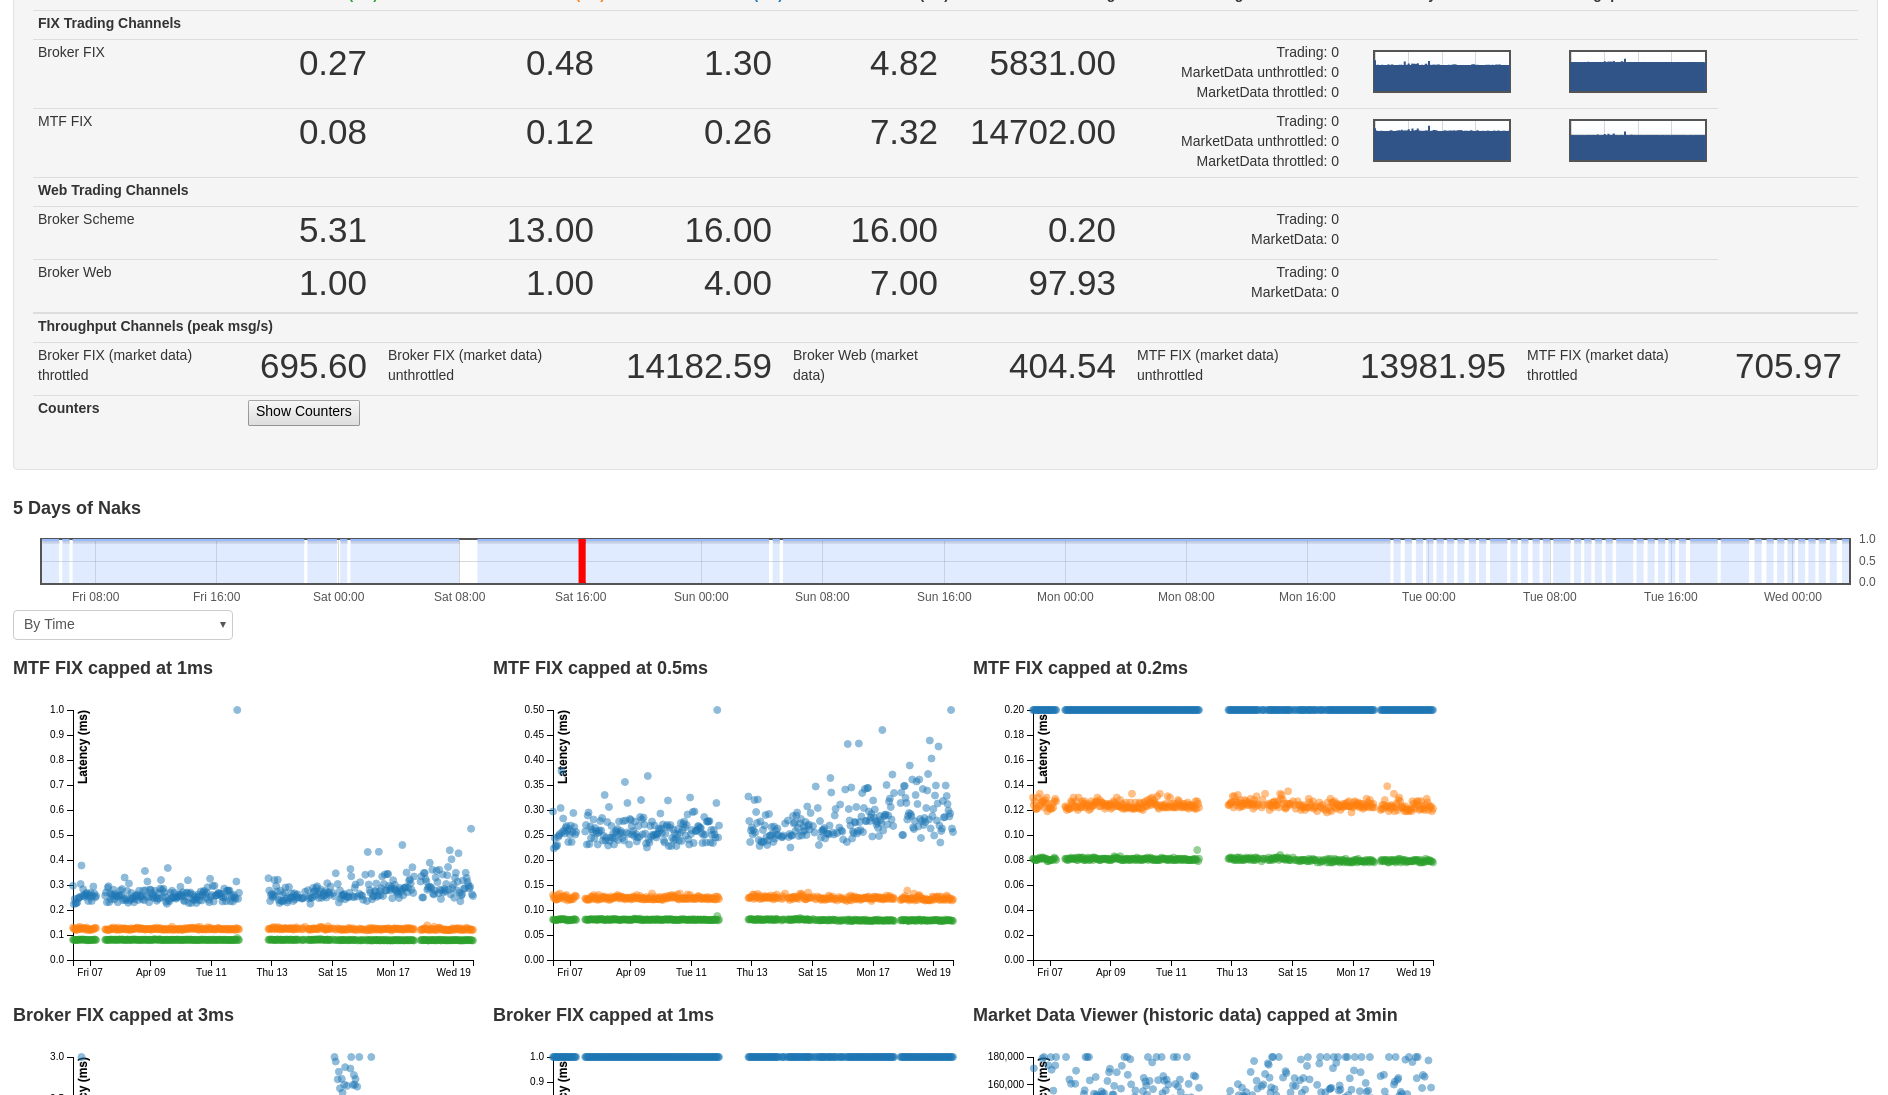
But we also collect a bunch of other metrics from our servers and services that, until recently, we didn’t have much visibility over.
Rediscovering these lost numbers started with us deploying a service with debug logging we were using to investigate intermittency to production. This gave some of our web servers a hard time, since they were logging lots more on certain types of requests. It didn’t have a huge impact, but it was definitely something we noticed, and didn’t really want to repeat. Especially since it took longer than we would have liked to trace the performance problems back to the additional logging.
This is the kind of thing you can’t really catch with the approach we use to cover our really performance sensitive code paths, which is a combination of replaying events and JMH micro-benchmarking. This is not because you wouldn’t actually be able to catch a performance regression with these tools, but because the time and effort we would expend. Covering everything that might possibly cause a performance problem at some point in the future with a JMH benchmark would probably double our already significant number of tests. Not to mention that it would massively increase how long our tests take to run.
So we decided needed something to cover more ground. Turns out that we already had the data we needed, we just weren’t actually making decisions based on it. We collect a lot of information from all of our environments, for example one of our CI environments has around 600,000 metrics that have had numbers against them across all of it’s servers. There’s a ton of potentially useful information in there: GC pause times, open file handles, as well as more application specific stuff.
We do surface all of that in some pretty (basic) graphs:
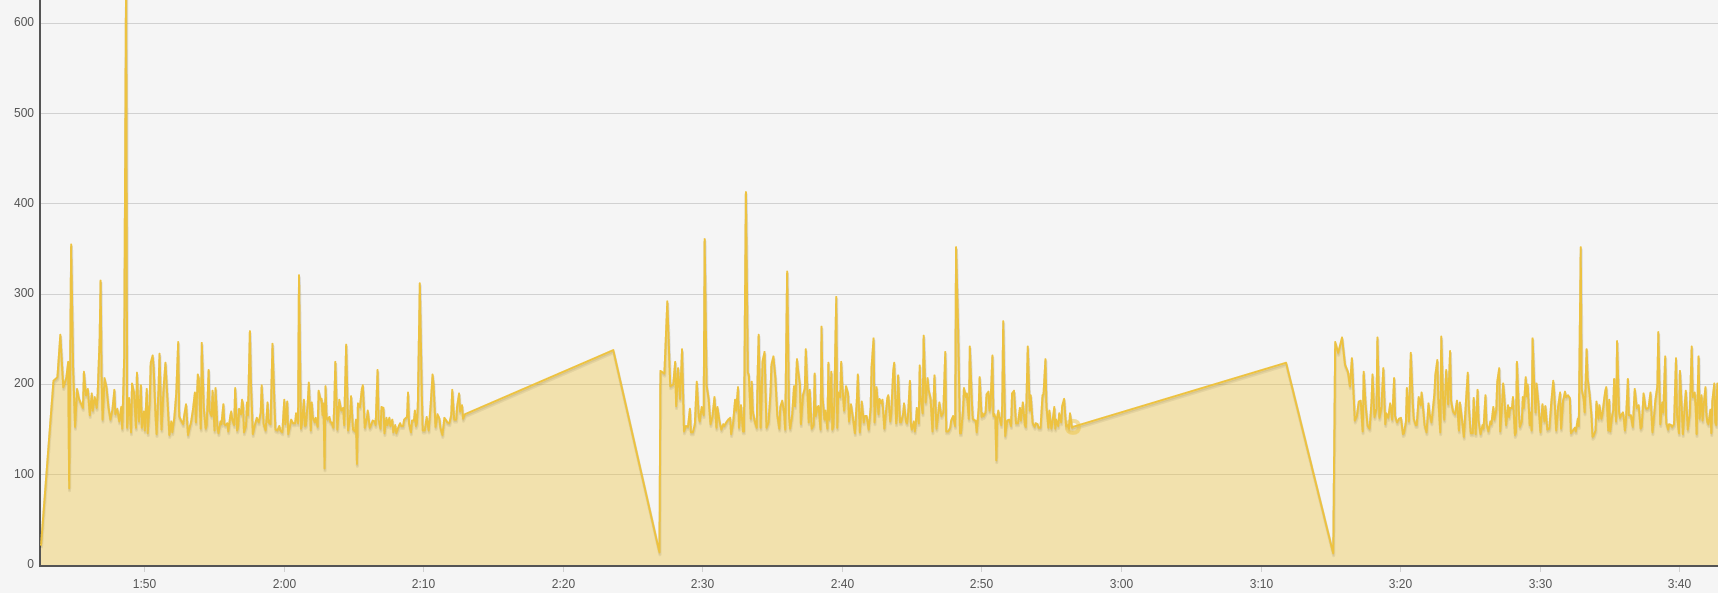 These do get used when we’re troubleshooting, and can generate alerts in our
production monitoring. But we haven’t really exploited them fully for our
testing cycle.
These do get used when we’re troubleshooting, and can generate alerts in our
production monitoring. But we haven’t really exploited them fully for our
testing cycle.
The open file handles we’d already used in a check on some of our reporting services, since we’d had issues with those not cleaning up after themselves. We thought we’d take that and riff on it a little for other numbers.
Our goal was to “catch regressions in unexpected places”, so we took a bunch of system and jvm level metrics we thought might be applicable: GC Pause times, running proc count, and load average. We picked these since they’re some of the more general performance indicators we could think of. That’s good since we’re looking to catch any and all regressions, rather than target anything application specific.
Essentially all we did was pick the average or maximum for these values out of our metric store, and compare it to a number in our checker. We set some overrides for specific values on specific services, since we expect some of our services like the exchange to use a lot more resources than say our web app servers.
Of course we wanted to prove this would have actually caught the problem that kicked all this off, so we ran these tests over the metrics we collected from the dodgy build to verify that it would have failed if they were in place. In that case, the load average check did fail due to all the additional string processing we were doing.
These checks are pretty crude at the moment. We’re hoping they’ll be effective in the long run, but if they aren’t, that’s fine. Crude measures can be refined, but things you aren’t looking at are never gonna be improved. Of course if we figure out at some point these checks are causing us more pain than they’re saving us, we’ll look at finding another solution.
We did try some mildly fancy stuff involving doing a regression over the data to check if we were leaking resources over time, but our acceptance style (involving hardware and topology pretty close to our production environments) perf test runs take on the order of half an hour, which isn’t really long enough to produce an alertable trend.
This process also delivered some value in another way. In the process of setting overrides for our services, we discovered that some of them were experiencing longer GC pauses than we would like. Again, these are off the path we have pretty well covered. None of them are at panic inducing levels, but some are definitely at moderate concern inducing levels, and something we’re digging into.
Hopefully this showed you a little bit of our process for dealing with issues we encounter. Not so much the actual finding and fixing part, but more the making sure it doesn’t happen again part. Also you should go take a look at some of the numbers you’re collecting from your testing environments, or if you’re not collecting any, start. Since if you aren’t measuring a thing, it’s near impossible to improve it.