Where the GC Fears to Tread
Sep 22 2018A while ago at LMAX Exchange our staging environment was having services killed frequently by the OOM killer. This wasn’t that unusual, since our staging vms are relatively under-provisioned compared to our production environments
(We have separate performance testing environments, with much beefier hardware for making sure we go fast, whereas the staging environments exist more for testing our deployment and configuration.)
But it was irritating, since it led to a reasonable amount of toil on the part of both the dev and systems teams. We eventually ended up figuring it out, but it was a bit of a journey. All of the dev team was interested in it, so we begged, bothered and cajoled the whole story out of Nick, who did most of the digging. I thought it was good enough to share with the world at large, so I’ve reproduced his presentation in blog form here.
So one of our systems team was having a bit of a poke around for services that were using more memory than they perhaps should have been:
#Search for java services...
ps -eo pid,comm,rss,cmd | grep java | grep -v grep |
#...pull the Xmx and display name paramters out of the command line...
awk '{ match($0,/Xmx[^ ]+/,a) ; match($0,/display.name=[^ ]+/,b) ;
       printf "%s PID=%s RSS=%s %s %s\n", $2, $1, $3 , a[0], b[0] }'
#... then print them

#...
#java PID=18168 RSS=627804 Xmx128m display.name=payment-svc
#java PID=18169 RSS=1147628 Xmx256m display.name=account-svc
#...
I’ve elided most of the output above to highlight the two interesting services. These have their maximum heap set fairly low, much lower than the ~600m and ~1.1g they’re using.
So what’s going on, and how can we figure that out? At this point I’m going to pull a bit of a bait and switch on you, so you can follow along at home if you want. Nick, also made a little demo app that showcases a lot of the ways you can use up memory in the JVM, which you can find on Github.
The demo app is subject to the same leak we have had in production, as well as showing off a few other ways you can leak memory. It’s also a lot smaller than the services we were dealing with, so you won’t have as much “fun” searching through the codebase for the culprit. I’d encourage you not to look through the code in the demo app, and instead follow the investigation in this post.
If you’re not particularly interested in that, and just want to hear a good story about memory usage gone wild, feel free to skip ahead
If you do feel like following along, clone the source from the repo using git clone https://github.com/Palmr/java-off-heap-leak-example.git and use gradle assemble twice to build it. (Apparently there’s something wrong with the subproject dependency ordering or something…
Once that’s done you can extract the built artifacts: cd build/distributions && unzip OffHeapLeakExample-1.0-SNAPSHOT.zip
Then head in and run the app: cd OffHeapLeakExample-1.0-SNAPSHOT && ./bin/OffHeapLeakExample.
If that gives you any issues, have a look at the Readme, or raise an issue. I’m sure Nick will be happy to help.
Sifting through the heap
So first order of business how much memory does it reckon it’s got in the heap?
That’s fairly easy to figure out using jmap -heap $PID:
$ jmap -heap 22974
Attaching to process ID 22974, please wait...
Debugger attached successfully.
Server compiler detected.
JVM version is 25.172-b11

using thread-local object allocation.
Parallel GC with 20 thread(s)

Heap Configuration:
   ...Elided, for being uninteresting...

Heap Usage:
PS Young Generation
Eden Space:
   capacity = 183500800 (175.0MB)
   used     = 123278096 (117.56715393066406MB)
   free     = 60222704 (57.43284606933594MB)
   67.18123081752232% used
From Space:
   capacity = 30408704 (29.0MB)
   used     = 0 (0.0MB)
   free     = 30408704 (29.0MB)
   0.0% used
To Space:
   capacity = 30408704 (29.0MB)
   used     = 0 (0.0MB)
   free     = 30408704 (29.0MB)
   0.0% used
PS Old Generation
   capacity = 489684992 (467.0MB)
   used     = 0 (0.0MB)
   free     = 489684992 (467.0MB)
   0.0% used
In our case we got numbers nowhere near the size of the resident set. So what else does a JVM allocate? Well, we’re about to enter the strange and terrifying world of Off heap memory. It’s a dark and twisted place where the normal rules of garbage collection are suspended in favour of the freewheeling rules of user managed allocation. Thankfully, most of the users in this case are still under the control of the JVM itself: Metaspace and Direct Buffers.
Both of these we can inspect the using jVisualVM, which is bundled with the Oracle JDK.
If $JAVA_HOME is set to point to an Oracle JDK you can just do $JAVA_HOME/bin/jvisualvm and it should start up,
and if we go have a look at the monitor page we should see something like:
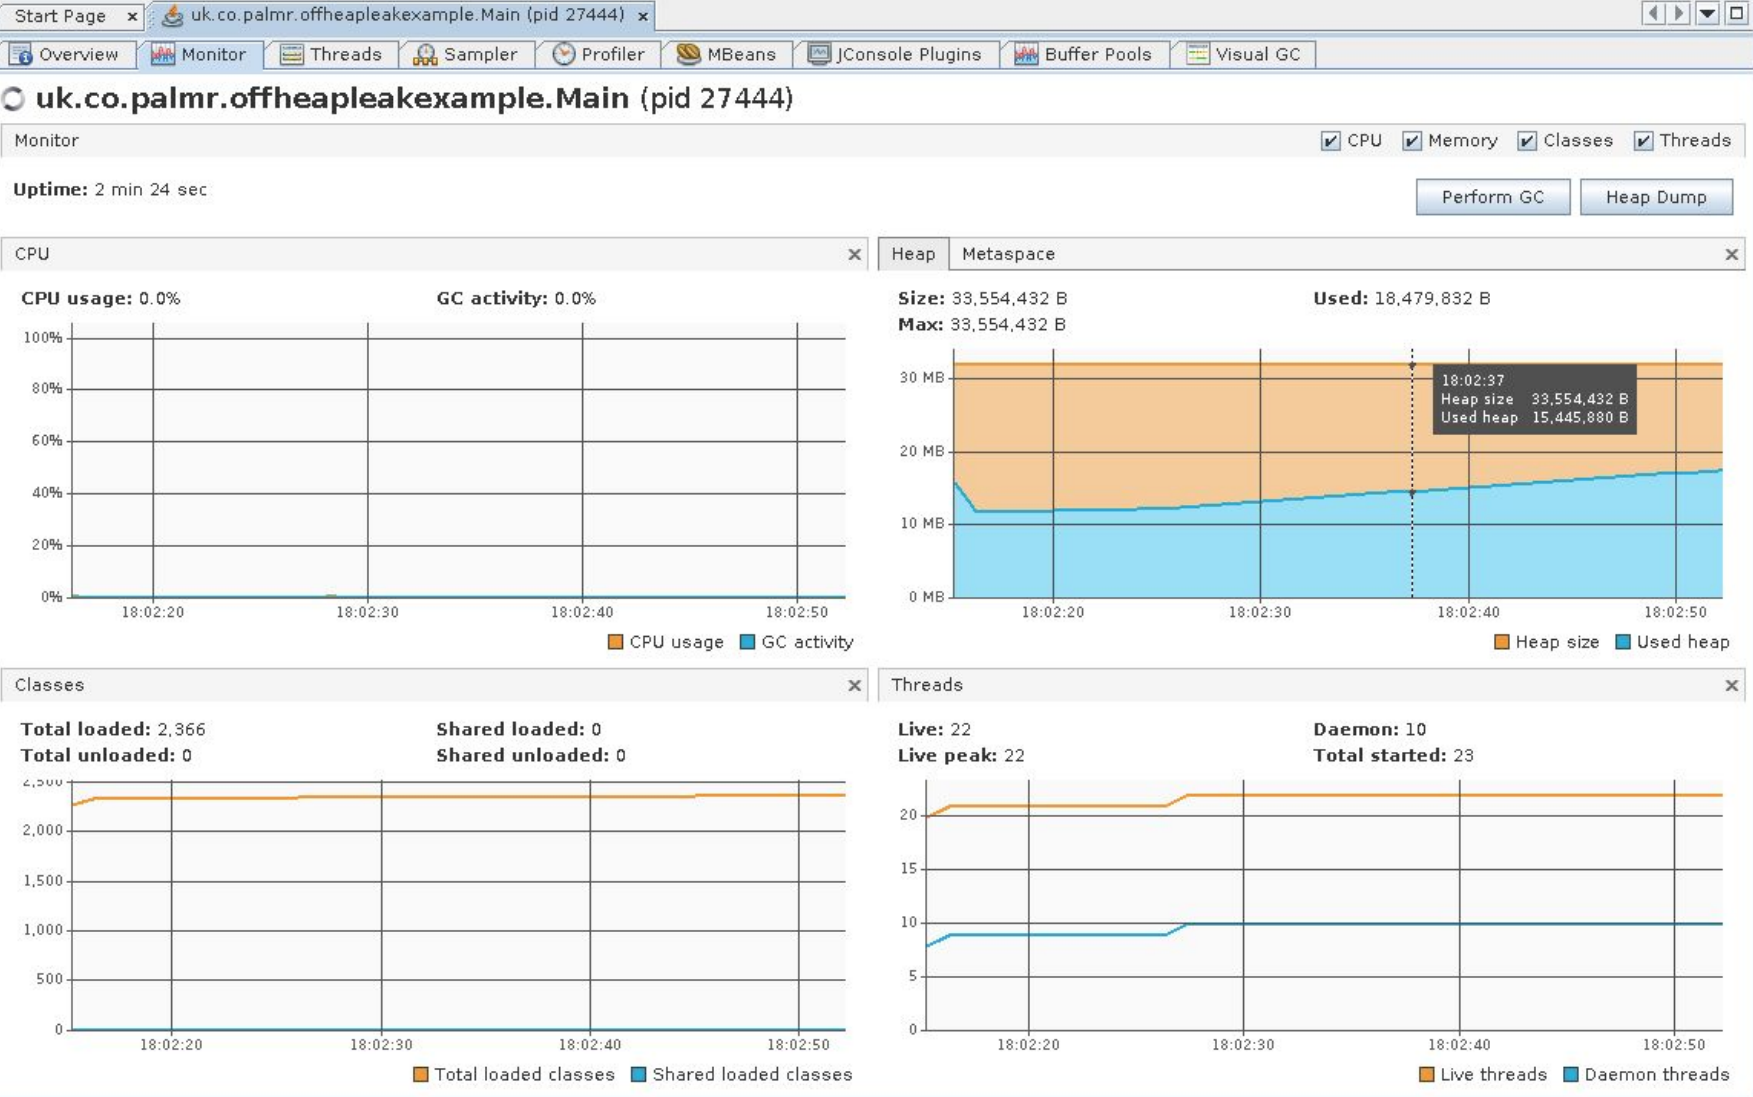
Nothing here seems particularly amiss, right? The heap usage is fairly low, there’s a few threads running, but nothing too crazy going on here. So at this point we’re pretty sure that heap allocation isn’t the cause of our problems. What else can we dig into using jVisualVM? Well I’ve already given that away a bit - we can examine the Buffer Pools tab:
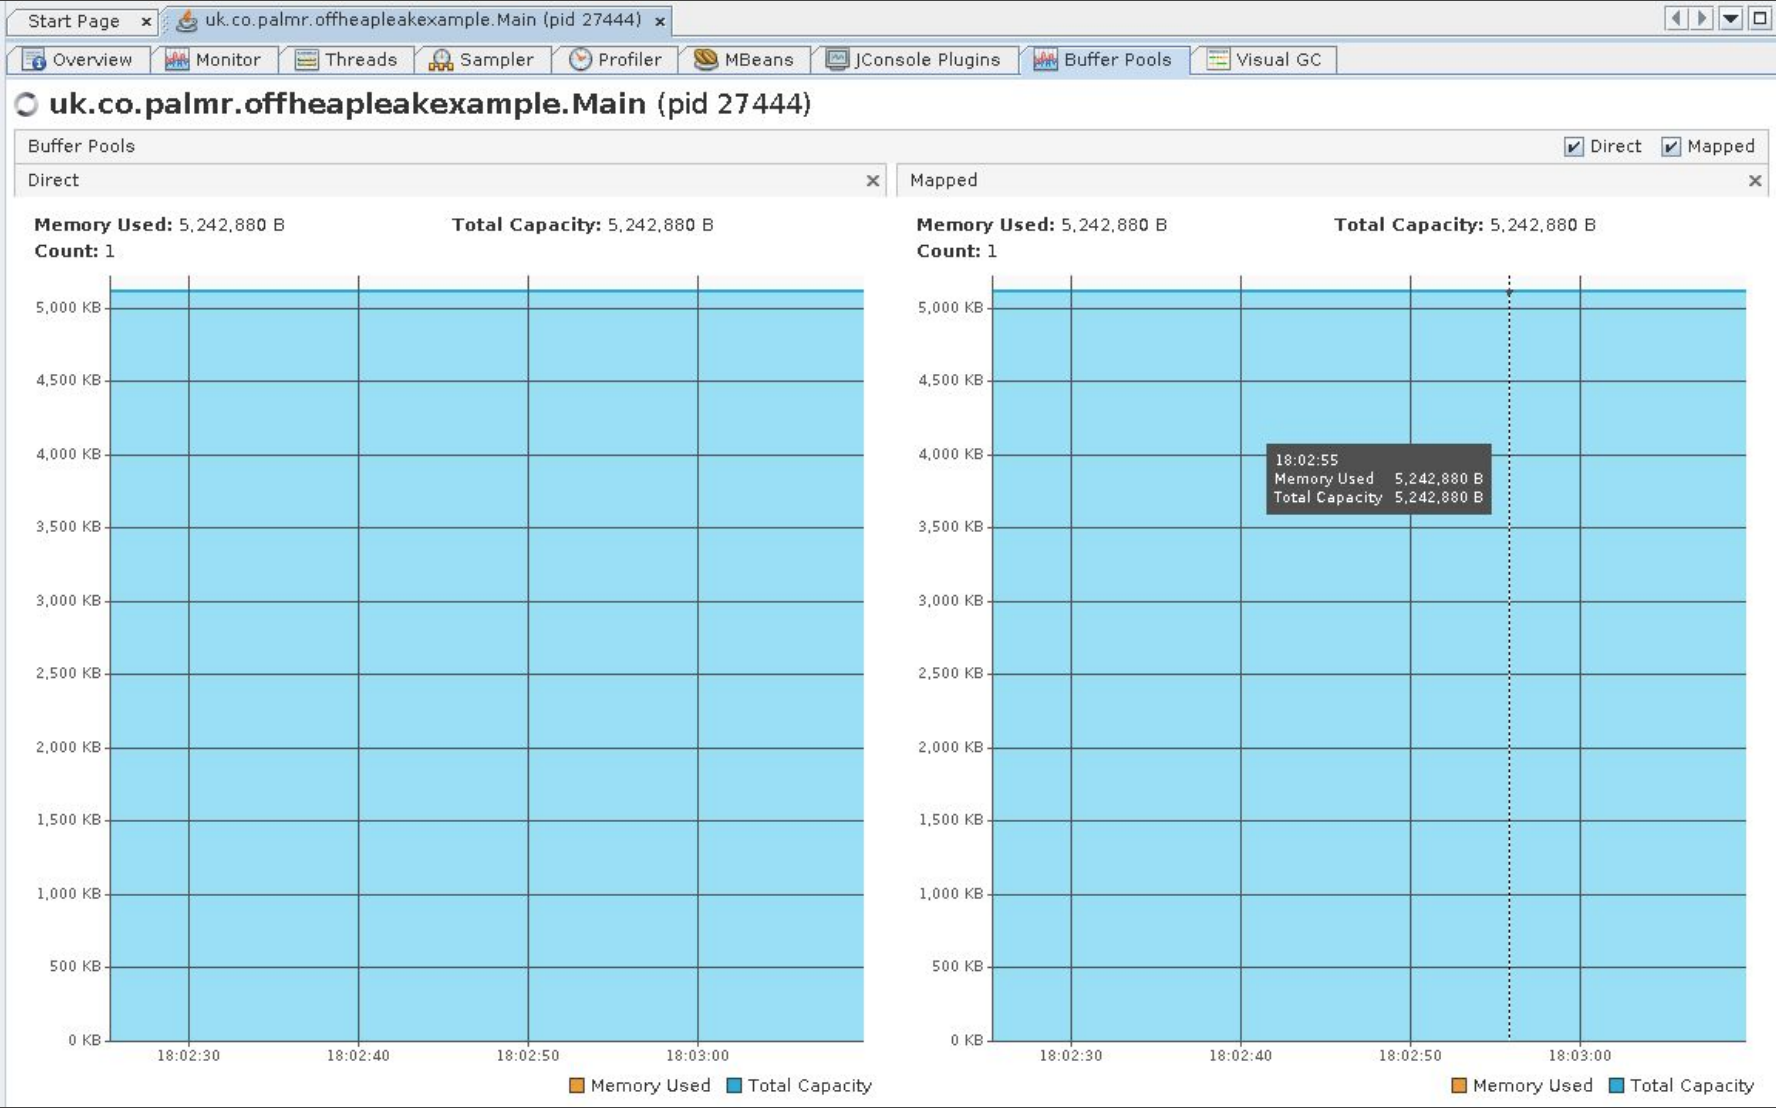
As you can see, this shows the memory committed to Direct and Mapped buffers. In the case of this demo app the allocation is flat - nothing to see here. The other bit we should have a look into is the Metaspace, the size of which we can see in the VisualGC tab:
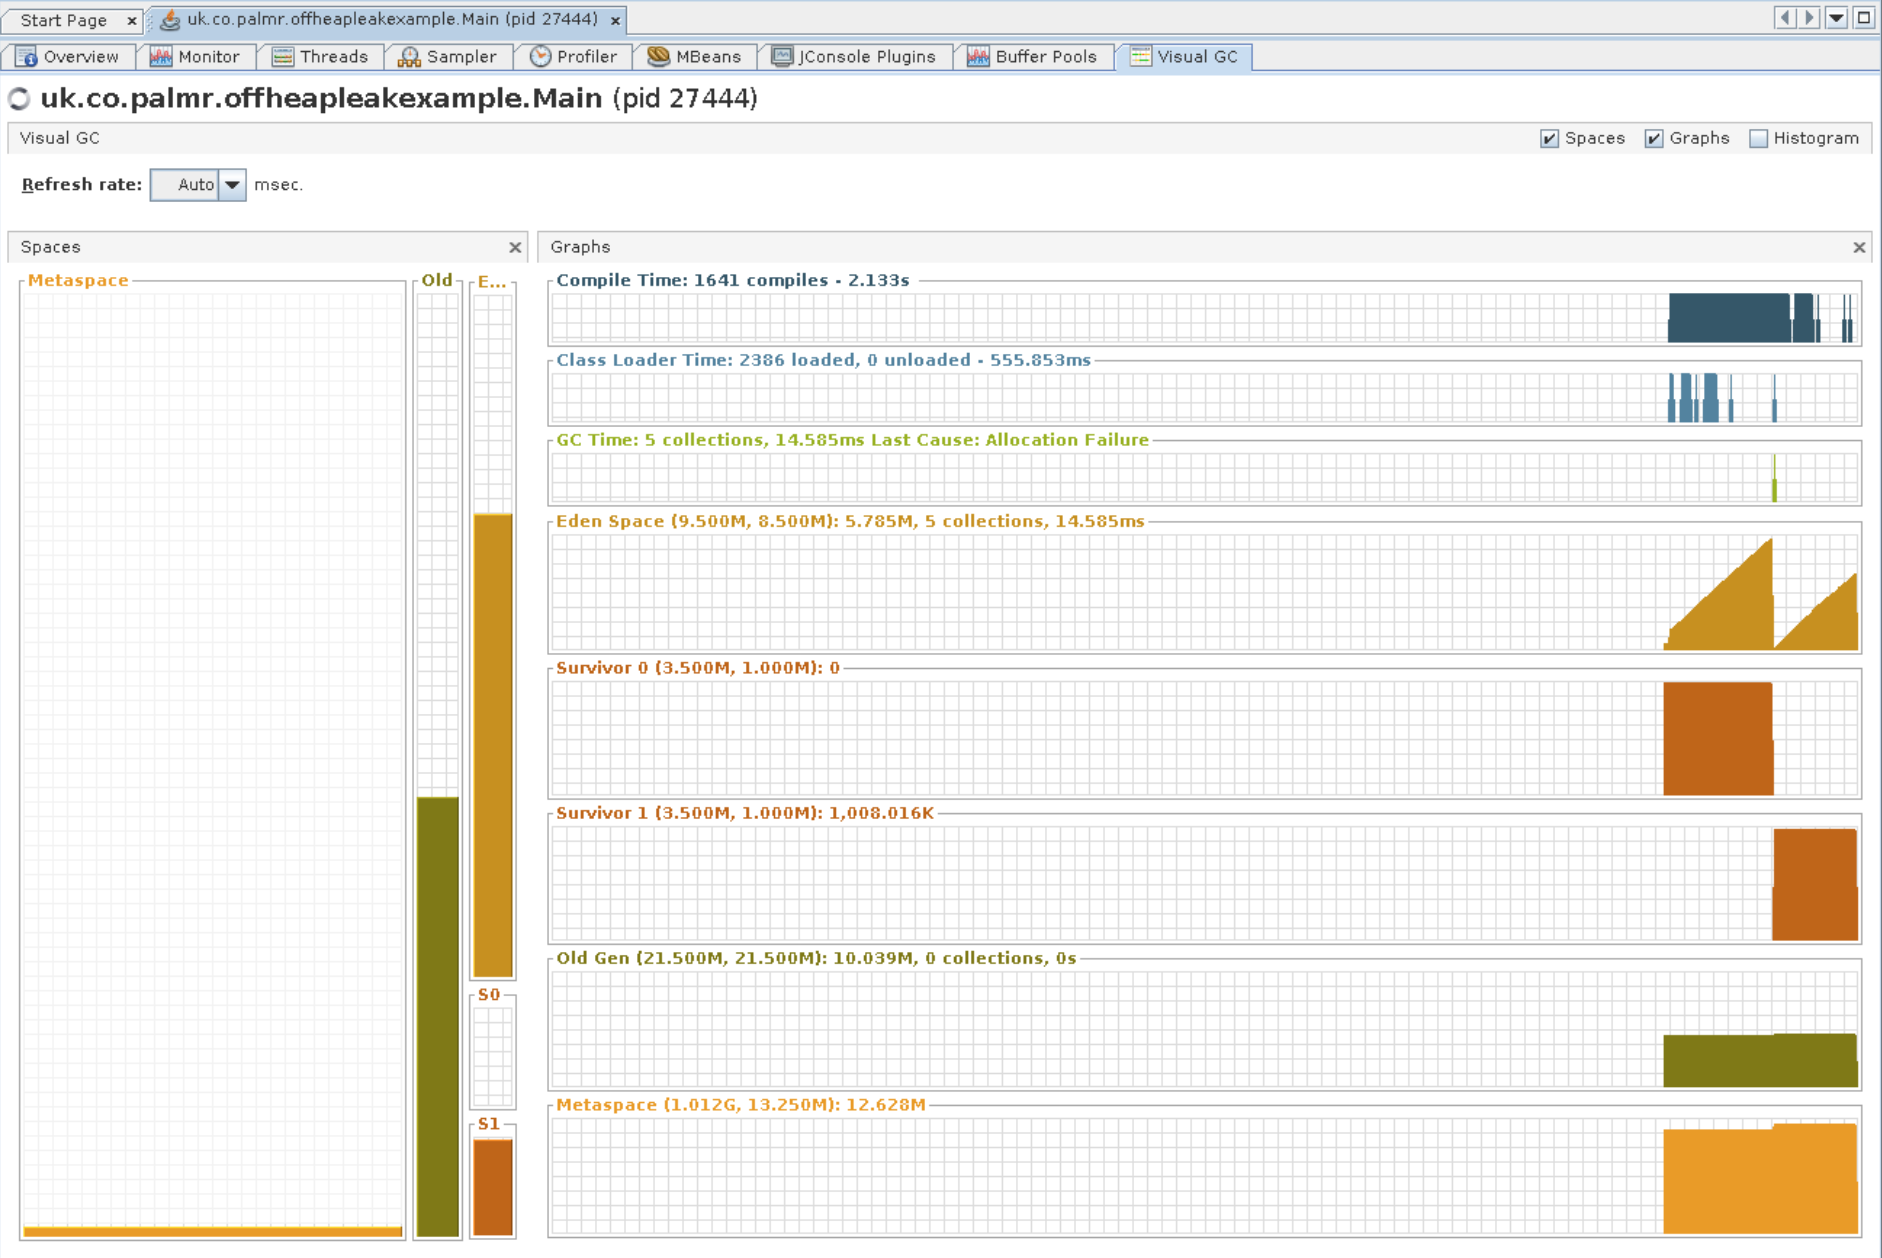
(Note that this is an optional plugin to jVisualVM, and might not be included with your distribution.
If that’s the case you can download it inside jVisualVM under Tools | Plugins | Available Plugins)
That’s the orange bit right down the bottom there: we can see it’s not really changing. Strike off another one.
We’ve pretty much exhausted what jVisualVM is able to tell us, but while we’re here I should mention the way you’d
normally find a leak in Java - with a Heap Dump. If you go back to the monitor page (or just scroll up a bit), you’ll
see a Heap Dump button on the top right. Whacking that should take you to a page something like this:
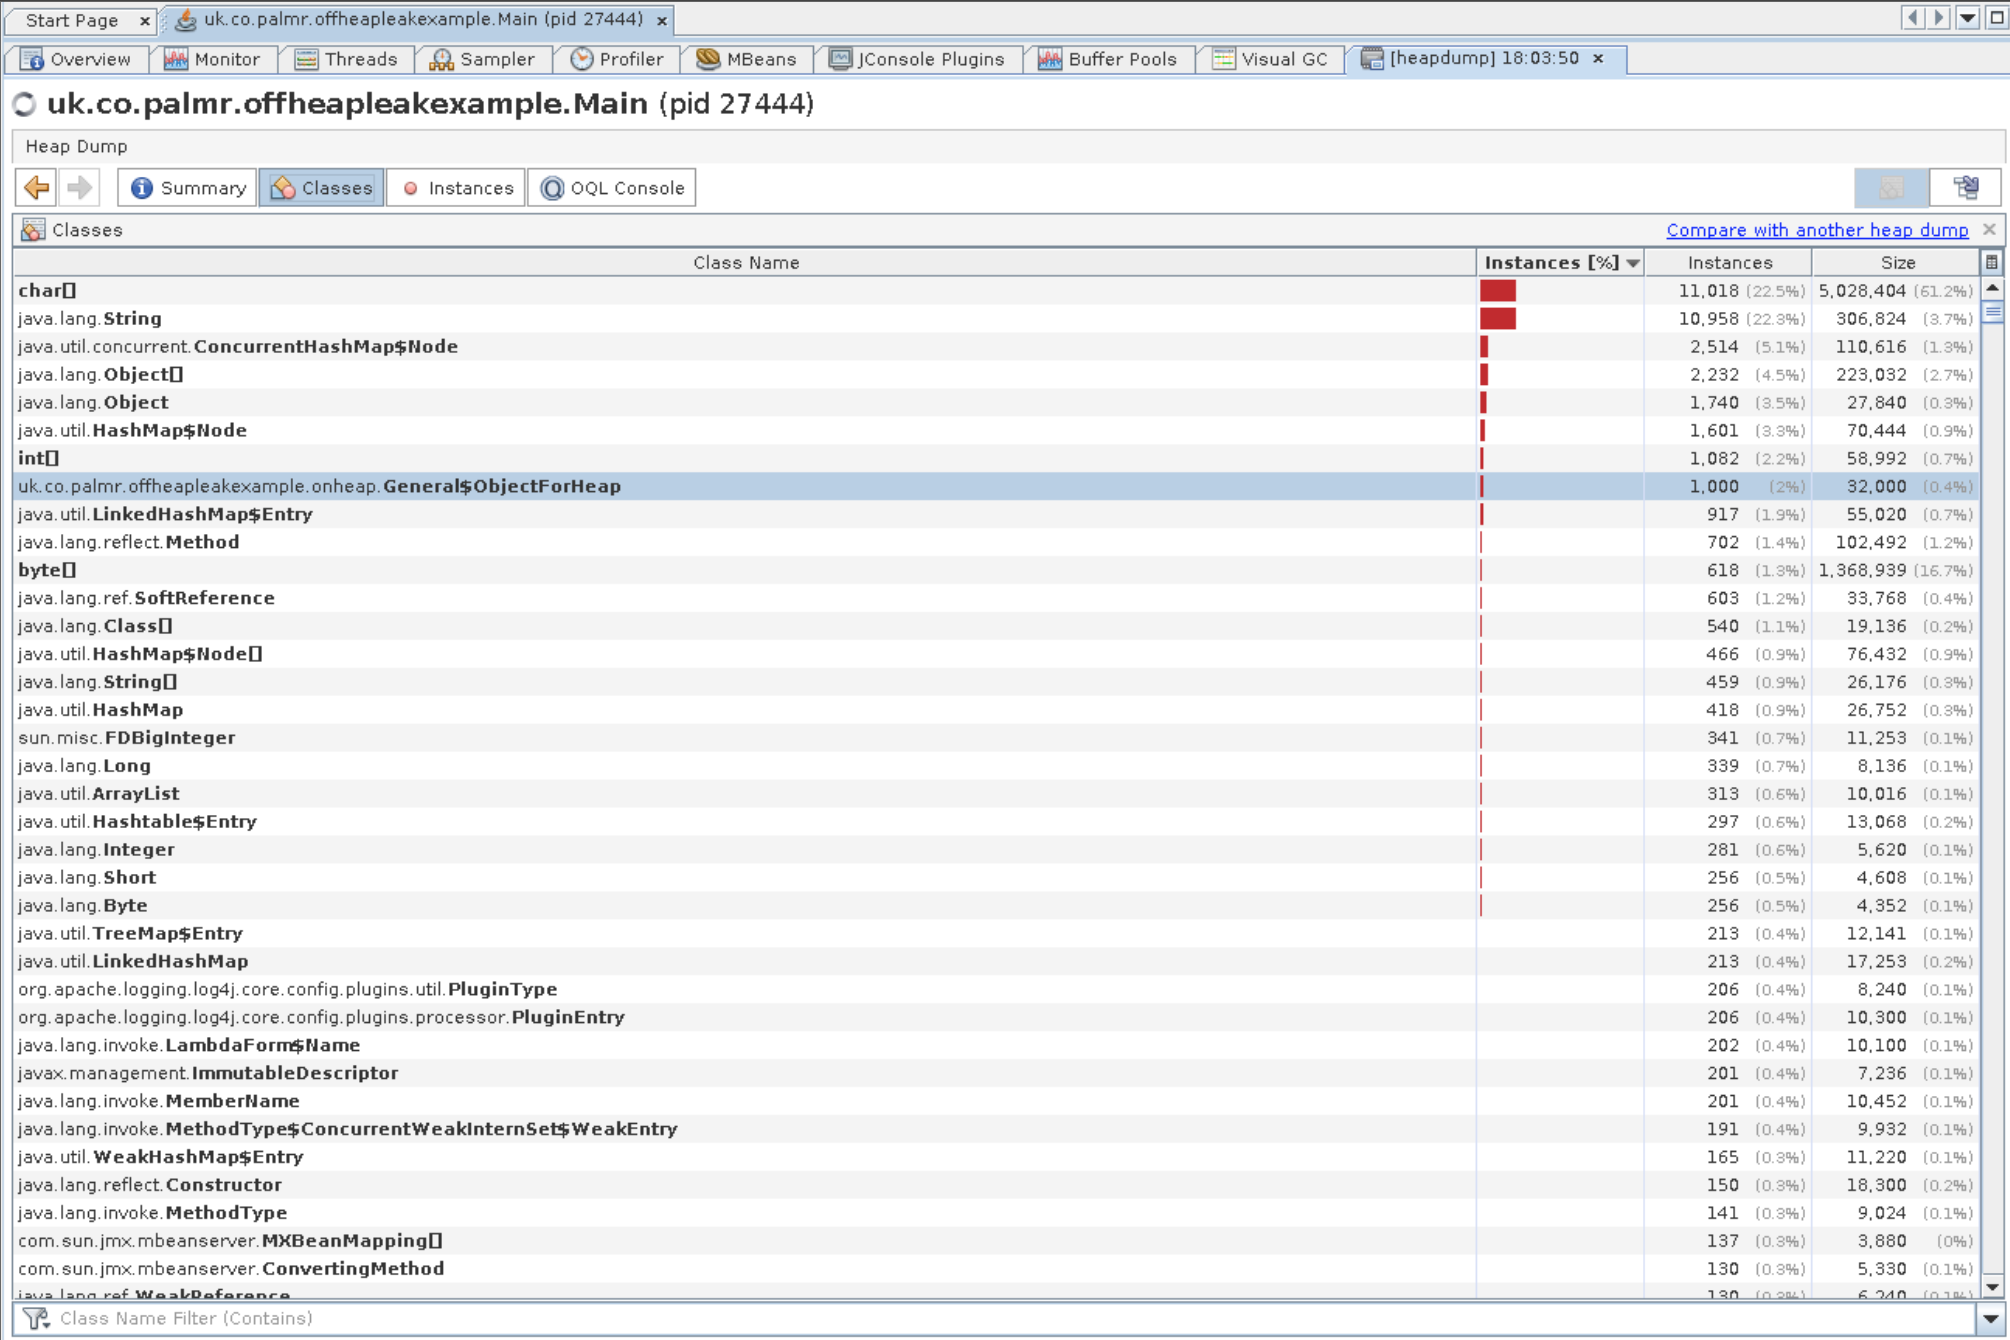
Given the heap size looked as we expected it according to jmap and the other tabs, there’s not much to see here. There’s 1000 objects the example makes which you can trace GC roots and generally have a bit of a poke about, but they aren’t the smoking gun we’re looking for. There’s also one other leak that you’ll be able to find from here. That’s left as an exercise for the reader, if you want the answer it’s in the slides that are linked to in the example app’s readme. There’s another war story behind why we know about that particular leak being a thing, but that’s for another time.
So. Now we have to get a bit deeper into the weeds. What about the memory allocated and used JVM itself?
Fortunately, there’s a tool for investigating that:
Native Memory Tracking (NMT).
This is accessed via a command line flag: -XX:NativeMemoryTracking, with two useful values:
-XX:NativeMemoryTracking=summary and -XX:NativeMemoryTracking=detail. This does of course come with a hit in terms
of performance, between 5 and 10 percent. In order to actually make use of it, you should use
jcmd to get snapshots:
jcmd ${PID} VM.native_memory baseline and then diff them against baselines: jcmd ${PID} VM.native_memory summary.diff.
For example when I run them against the example app:
#This is included in the baseline_NMT_and_log_memory.sh
#script Nick created.

$ jcmd 24055 VM.native_memory baseline

#... some time later

$ jcmd 24055 VM.native_memory summary.diff
24055:

Native Memory Tracking:

Total: reserved=1473463KB +41KB, committed=181895KB +105KB

             Java Heap (reserved=32768KB, committed=32768KB)
                       (mmap: reserved=32768KB, committed=32768KB)

                 Class (reserved=1080633KB, committed=33465KB)
                       (classes #1947)
                       (malloc=21817KB #1580 +15)
                       (mmap: reserved=1058816KB, committed=11648KB)

                Thread (reserved=52514KB, committed=52514KB)
                       (thread #52)
                       (stack: reserved=52288KB, committed=52288KB)
                       (malloc=166KB #277)
                       (arena=60KB #90)

                  Code (reserved=250105KB +11KB, committed=5705KB +75KB)
                       (malloc=505KB +11KB #1414 +43)
                       (mmap: reserved=249600KB, committed=5200KB +64KB)

                    GC (reserved=25423KB, committed=25423KB)
                       (malloc=24219KB #172)
                       (mmap: reserved=1204KB, committed=1204KB)

              Compiler (reserved=137KB, committed=137KB)
                       (malloc=6KB #75)
                       (arena=131KB #15)

              Internal (reserved=27748KB, committed=27748KB)
                       (malloc=27716KB #3628)
                       (mmap: reserved=32KB, committed=32KB)

                Symbol (reserved=3469KB, committed=3469KB)
                       (malloc=2215KB #9816)
                       (arena=1255KB #1)

Native Memory Tracking (reserved=459KB +30KB, committed=459KB +30KB)
                       (malloc=157KB +24KB #2210 +329)
                       (tracking overhead=302KB +6KB)

           Arena Chunk (reserved=206KB, committed=206KB)
                       (malloc=206KB)
Basically, there’s not a lot going on here - looks like the JVM isn’t responsible for allocating the memory we’re looking for. What next?
Outside the JVM
We’ve still got one more place to look: in memory that’s allocated from native code which we invoke via
Java Native Access (JNA) or
Java Native Interface (JNI). The memory that’s allocated by
native code is still tied to the JVM process - since it’s still responsible for invoking the code in question, but the
JVM doesn’t have any ability to see or control what the native code mallocs.
There’s plenty of tools for examining memory allocation, for instance Valgrind, but we’re just humble Java programmers and Valgrind seems hard. Looking around a bit we found simpler tools, specifically jemalloc.
Jemalloc is a malloc implementation that includes the ability to profile all of the allocations that are requested,
and will very helpfully show you the full stack trace leading to that allocation. It can be fairly easily added when
running a process via an environment variable: LD_PRELOAD=${JEMALLOC_PATH}/lib/libjemalloc.so.2 <COMMAND_TO_RUN>
In our case since the application we’re profiling doesn’t exit, you probably want to also add some environment variables
so it emits information during the run: export MALLOC_CONF=prof:true,lg_prof_interval:25,lg_prof_sample:17 -
that’ll cause it to memory profile dump every 30 mB, allocation sample every 128 kB. (The configuration options are in
log base 2)
Since Nick’s a real good guy, jemalloc is used by default,
and there’s a script that’ll automagically produce a pretty chart in the bin directory.
If you’re doing it the hard way, you should end up with some files kicking around - something like jeprof.19678.0.f.heap. That can be fed into jeprof
to get some pretty pictures using jeprof --show_bytes --pdf jeprof.19678.0.f.heap > w.pdf, which should emit something
like:
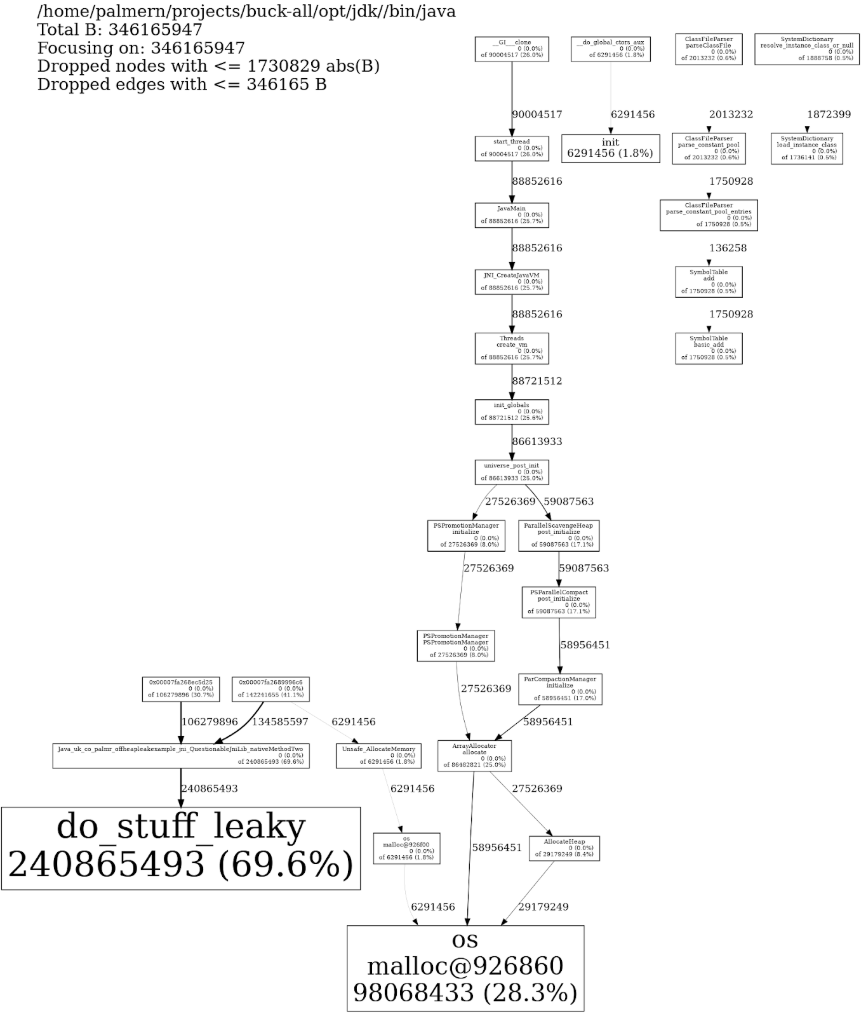
You can also go via dot, there’s an example of that in Nick’s script
Which does seem to contain something rather like a smoking gun… and indeed, if we look for that we find:
void do_stuff_leaky(char* string)
{
    char* str = (char*) malloc(allocation_amount);
    memset(str, 0xff, allocation_amount);
    strcpy(str, string);
    printf("String = %s, Address = %p\n", str, (void *) str);
    fflush(stdout);

    //Whoops!
    //free(str);
}
If you followed all that along, good work, you solved the mystery, and definitely not with my help! Hopefully next time you Java program OOM’s, you can just stop at like step two though. That said, the actual issue was a touch more interesting, so let’s have a quick run-through of what was happening there.
The real leak
So the services we were dealing with (account service and payment service) weren’t particularly heavily loaded - they’re definitely off the hot path for our trading flows. Also our staging environments are fairly under-utilized, they probably burn 90% of their cpu cycles during deployment and startup. One would expect that an environment that didn’t get much traffic wouldn’t have much in the way of performance or memory issues, but in this case it was exactly because the environment was under utilized that we got into trouble. But first, a quick detour to talk about reliable messaging over UDP.
So much like developers of video games, those of us writing high performance financial software prefer UDP to TCP for it’s performance.
However, we have strict requirements around reliability, that is we can’t afford for our services to miss messages. Because of this, we have a scheme of Negative Acknowledgement or NAKing for short. The reason we choose to use NAKs rather than the ACKs traditionally seen in TCP is because in the normal, no packet loss environment, we don’t have to wait for the receiver of a message to acknowledge it before we can send them more data. When using this kind of scheme, every message gets a sequence number, again, similar to TCP.
When we do lose a message somehow, a service will NAK to the sender of message when it sees a gap in the sequence numbers, and the service will (hopefully) resend a copy of that message by reading it back out of it’s memory. This does introduce a significant “hiccup” in the sender, since it has to scan back through memory, but in the normal case we expect to be operating in it’s significantly more efficent than the alternative.
Why is this important? Well back in the mists of time, many of our services upon starting up would send a NAK to other services that they listened to, in order to ensure they were up to date with what had been sent. We alert on NAKs in our monitoring system (since normally they’re indicative of something going wrong) so on startup our monitoring would light up like an angry christmas tree, typically spooking whoever was doing work on the system.
In order to prevent this, we added a heartbeat mechanism, that would send a message with the latest sequence number, once a second if there was no other traffic between services. We could use this to determine the starting point for a freshly booted service, without firing off NAKs. This also helped us reduce the potential impact of some cases of message loss. Obviously this message was fairly small, since it only had a single 64 bit value and some headers on it.
The other thing that’s worth mentioning, is that our application level NAKs aren’t the only NAKs in town. We’ve built on top of a lower level library we buy which provides a fairly fast UDP networking layer. This also maintains it’s own store in memory that it is able to service NAKs from, at it’s layer.
This storage is set to a fairly small amount - 25mb by default. However, this library also maintains a header alongside the message body (this header isn’t send across the wire - we’re not really sure what it’s for.). These headers are about 200 bytes in size, and are not counted towards the 25mb limit. In our case with the heartbeat messages, these were only about 12 bytes in size, so in order to fill the 25mb buffer, we’d need around 2 million messages to be sent, each allocating a 200 byte header, meaning we’d end up using around 400mb for the headers. That’s quite a bit more memory usage than we expect, especially given these services were running with heaps around half that size.
At this point you might be asking me about the numbers we came up with right at the beginning of this, since they were bigger than that 400mb, and surely we didn’t leave our staging environment alone for the 24 days or so these buffers would take to fill up in any case? You’re right on both counts, however the underlying messaging library, and our heartbeating scheme above it both work on a per topic basis - so we were sending these messages significantly more than once a second, and giving them more than just one 25mb buffer to fill.
We have since fixed the issue (we don’t need the lower level NAKs when we already have application level ones, so we’ve smashed that buffer) and now quite happily spend much less time resurrecting dead services on our staging hosts!
Summary
That was quite a lot of words, so good work if you read the whole thing. Hopefully you’ve learned a thing or two! If you’re looking for more resources, there’s quite a few links in Nick’s slides or I’m happy to try and answer any questions you’ve got on twitter.